Sales Advantage
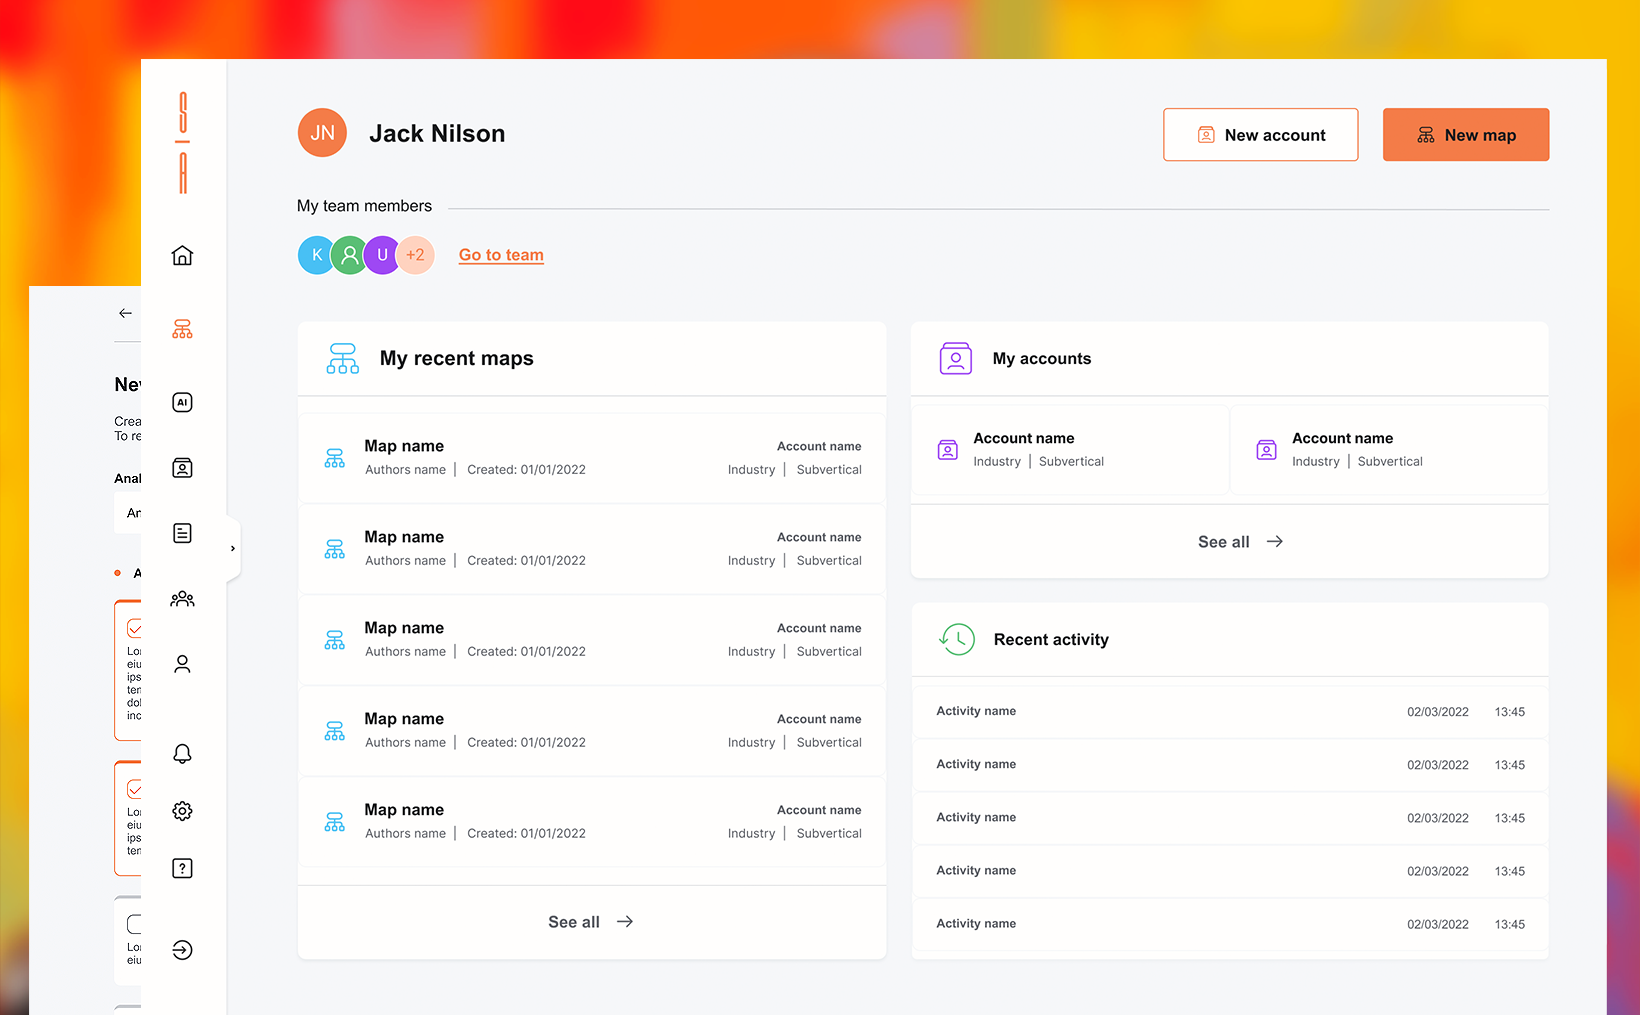
Sales Advantage is a company specializing in AI-powered sales solutions. Their platform leverages AI to analyze annual reports and 10-K filings, providing businesses with valuable insights and opportunities. They offer tools for team collaboration, automated value proposition generation, and interactive customer engagement maps, all designed to enhance sales strategies and drive growth. Their focus is on transforming business development through advanced, AI-driven automation and data analysis.
The problem
Account managers in various companies encounter significant challenges when attempting to interpret and utilize the information contained in Q-10 (Quarterly Reports) and K-10 (Annual Reports) filings submitted to the Securities Exchange Commission (SEC). These documents are crucial for making informed financial and strategic decisions, yet their complexity and the dense legal and financial jargon used can make them nearly impenetrable for individuals without specialized training. The reports often include extensive quantitative data, detailed notes, and technical disclosures that can be overwhelming and time-consuming to analyze. This complexity is compounded by the fact that these documents must adhere to strict SEC regulations and guidelines, ensuring they include comprehensive details on a company’s financial performance, risk factors, market conditions, operational strategies, and future outlooks.
The difficulty is not just in the volume of information but also in how critical nuances and vital data are embedded in lengthy, complex narratives. Account managers must sift through this information to identify relevant data points that can impact their company’s financial strategies, risk management, and investment decisions. The challenge is further intensified by the need to monitor competitors’ filings, industry trends, and regulatory changes, all of which can influence the interpretation of these documents.
Moreover, the stakes are high, as inaccuracies or misunderstandings can lead to poor strategic decisions, misallocation of resources, or non-compliance with regulatory standards, potentially resulting in financial losses or legal repercussions. Therefore, there is a pressing need for tools, methodologies, or educational programs that can assist account managers in effectively deciphering and leveraging the critical information contained in Q-10 and K-10 filings for strategic decision-making, competitive analysis, and regulatory compliance.
The approach
User-Centric Design: Develop an interface that simplifies the complex data, presenting it in a more digestible and intuitive format. This could involve dashboard visualizations, summarized key points, and interactive elements that allow users to explore the data in more depth based on their interests.
Customization: Implement features that let users customize their viewing experience, such as filters to focus on specific sections of the reports or alerts for key financial metrics, enabling them to quickly find the information that is most relevant to them.
Guided Navigation: Create a guided walkthrough for first-time users, helping them understand how to navigate the documents and highlighting important information they should be aware of. This can reduce the learning curve and improve the overall user experience.
Search Functionality: Integrate a robust search feature that allows users to query specific data or terms within the documents, facilitating quicker access to the required information without needing to go through the entire document.
Feedback Loops: Incorporate user feedback mechanisms to continuously improve the interface based on actual user experiences and needs, ensuring the solution remains effective and user-friendly over time.
By focusing on these elements, the platform can significantly enhance the ability of account managers to efficiently and effectively understand and utilize the complex information contained in Q-10/K10 documents.
The outcome
The solution enabled account managers to be able to generate value maps in 7.5 minutes. A task that would’ve taken them weeks to complete before this solution.


