[ 013 ]
Social Media Marketing Dashboard
Client
Independent
Year
C. 2019
Discipline
Dashboard
Data Viz
Status
Delivered
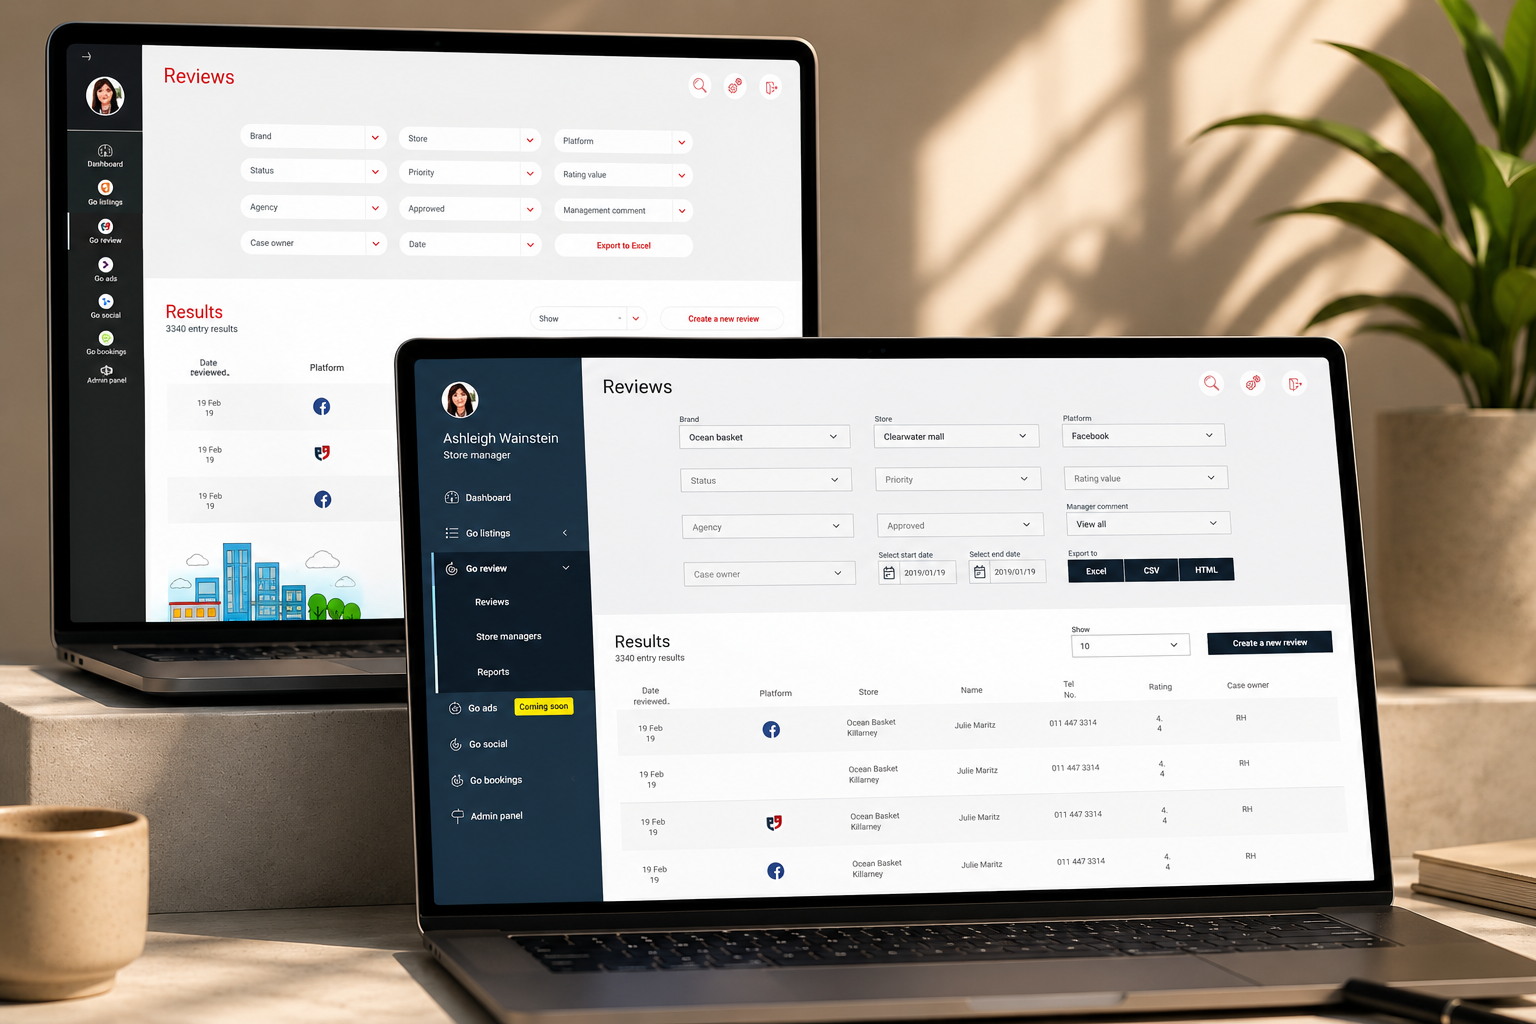
The dashboard consolidates activity and performance across multiple social channels into a single workspace. The design problem in this category is rarely access to data — it is that everything is presented as equally important.
The work was to establish a hierarchy: what needs a decision, what needs watching, and what is only relevant once a question has already been asked.
My Role
Solo UX/UI Designer. Solo designer on the dashboard, leading UX and UI end to end — including metric hierarchy, drill-down flows, module structure and the final data-visualisation interface.
The UX approach
The dashboard is structured as overview to detail. The top level answers how things are performing and what has changed; anything actionable — an anomaly, a scheduled item, a campaign moving out of range — is surfaced there rather than found by exploration.
Detail is reached by drilling into the metric that prompted the question, keeping the user's context intact instead of sending them to a separate report. Filters by channel, campaign and period apply across the view as a whole, so comparisons remain valid and the user never has to reconcile two differently-scoped panels.
Modules are consistent in structure, which makes an unfamiliar metric readable using knowledge of a familiar one.
The UI approach
A modular card grid allows density to vary by importance without breaking alignment. Headline figures are set large with their change and period attached, so a number is never shown without the context that makes it meaningful.
Chart types are chosen for the comparison being made rather than for variety, and a single accent colour marks state and change against an otherwise neutral surface. Whitespace and consistent grouping do the separating, keeping a data-dense screen calm enough to scan.